What is sum of the parts (SOTP) valuation?
Sum of the parts (SOTP) analysis is often used as break-up analysis. It focuses on measuring the value of a business with distinctively different divisions or varying degrees of equity investments in other companies. By doing so you can achieve a more accurate valuation than only using earnings, the balance sheet and cash flows.
Key topics covered in this technical update include:
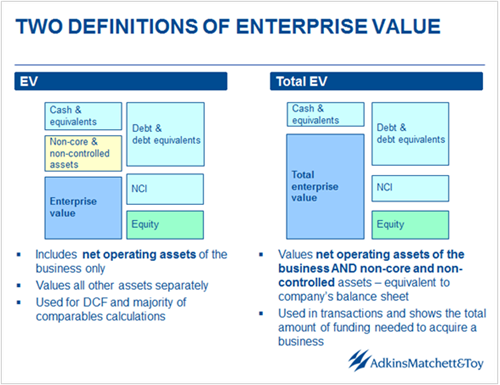
- Core and total enterprise value concepts
- A summary of M&A accounting and consolidation rules
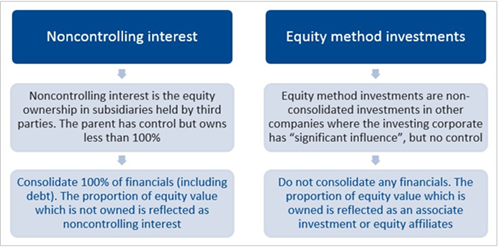
- Non-controlling interest
- Equity method investments (associates / affiliates)
- Mastering the enterprise value
- How to get it right?
- How to check that it is right?
What is enterprise value?
Enterprise value, henceforth called EV. Total enterprise value, henceforth called TEV.
M&A consolidation rules
While understanding enterprise value, bottom up, we will calculate the TEV of the parent by adding the individual enterprise values using the above M&A consolidation rules. For calculating the EVs of each individual entity we shall use the EBITDA multiple method, but you can use any other valuation methodology such as DCF.
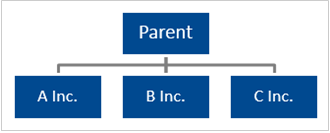
For this example we shall use a diversified company with three distinct businesses – a retailer with brick and mortar retail operations, real estate assets and online operations. Each business should trade at a different EBITDA multiple. All 3 cases have the same sub-entities but the difference lies in the % of equity ownership of the parent within each entity.
Before we get started with each case, we shall calculate each company’s individual TEV. At the moment we are ignoring the % equity ownership of the parent within each entity.
|
|
A Inc. |
B Inc. |
C Inc. |
|
EBITDA |
300 |
400 |
250 |
|
Net debt |
1,200 |
900 |
800 |
|
EBITDA Multiple |
10.5x |
13.0x |
9.0x |
|
Standalone – Bottom Up Analysis |
|
||
|
Equity value |
1,950 |
4,300 |
1,450 |
|
Net debt |
1,200 |
900 |
800 |
|
Enterprise value |
3,150 |
5,200 |
2,250 |
|
EBITDA |
300 |
400 |
250 |
|
EBITDA multiple |
10.5x |
13.0x |
9.0x |
Now we shall work through the 3 examples with different % of equity ownership in each entity by the parent:
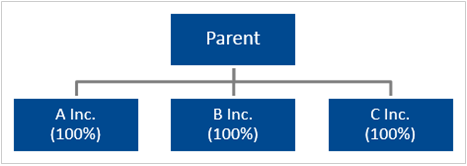
Example 1 – Each entity is 100% owned and controlled
- Step 1 – CALCULATE each company’s individual TEV (calculations as shown above)
|
Standalone – Bottom Up Analysis |
A Inc. |
B Inc. |
C Inc. |
|
Group holding |
100% |
100% |
100% |
|
Status |
Sub |
Sub |
Sub |
|
Equity value |
1,950 |
4,300 |
1,450 |
|
Total enterprise value |
3,150 |
5,200 |
2,250 |
- Step 2 – CONSOLIDATE and add together all TEVs as each entity is 100% owned and controlled by the parent
- Step 3 – RECONCILE the TEV
|
Consolidation |
Group |
Comments |
|
Equity value |
7,700 (1,950 + 4,300 + 1,450) |
Add together since all 100% owned |
|
Net debt |
2,900 (1,200 + 900 + 800) |
Add together since all 100% owned |
|
Non-controlling interest |
0 |
No NCI |
|
Total enterprise value |
10,600 (7,700 + 2,900) |
Sum of the above; can also be sum of the TEVs |
|
Equity affiliates |
0 |
No affiliates |
|
Enterprise value |
10,600 |
|
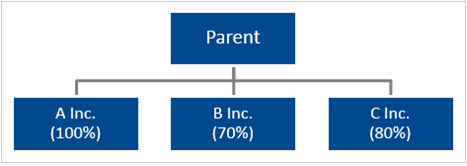
Example 2 – Less than 100% owned but controlled
- Step 1 – CALCULATE each company’s individual TEV (calculations as shown above)
|
Standalone – Bottom Up Analysis |
A Inc. |
B Inc. |
C Inc. |
|
Group holding |
100% |
70% |
80% |
|
Status |
Sub |
Sub |
Sub |
|
Equity value |
1,950 |
4,300 |
1,450 |
|
Total enterprise value |
3,150 |
5,200 |
2,250 |
- Step 2 – CONSOLIDATE even though less than 100% of B Inc. and C Inc. are owned by the parent, we still add together all TEVs as each entity is controlled by the parent (refer to the M&A consolidation rules stated above)
- Step 3 – RECONCILE the TEV
|
Consolidation |
Group |
Comments |
|
Equity value |
6,120(1,950 + 3,010 + 1,160) |
Equity value * the % owned by the group |
|
Net debt |
2,900(1,200 + 900 + 800) |
Add together since all consolidated even though less than 100% ownership |
|
Non-controlling interest |
1,580 (290 + 1,290) |
NCI in businesses B and C – this is equity value * the % owned by NCI – or total equity less group owned |
|
Total enterprise value |
10,600 (6,120 + 2,900 + 1,580) |
m of the above and also sum of TEV because 100% consolidated since controlled |
|
Equity affiliates |
0 |
No affiliates |
|
Enterprise value |
10,600 |
|
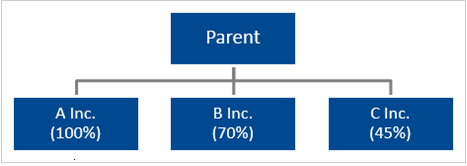
Example 3 – 100% owned and controlled + less than 100% owned but controlled + equity ownership with significant influence but no control
- Step 1 – CALCULATE each company’s individual TEV (calculations as shown above)
|
Standalone – Bottom Up Analysis |
A Inc. |
B Inc. |
C Inc. |
|
Group holding |
100% |
70% |
45% |
|
Status |
Sub |
Sub |
Equity Affiliate (EA) |
|
Equity value |
1,950 |
4,300 |
1,450 |
|
Total enterprise value |
3,150 |
5,200 |
2,250 |
- Step 2 – CONSOLIDATE, add together the TEVs of A and B Inc. as each entity is controlled by the parent, but only add the % equity owned in C Inc. (refer to the M&A consolidation rules stated above)
- Step 3 – RECONCILE the TEV
|
Consolidation |
Group |
Comments |
|
Equity value |
5,612.5 (1,950 + 3,010 + 652.5) |
Equity value * the % owned by group |
|
Net debt |
2,100 (1,200 + 900) |
Add together the businesses which are consolidated – ignore the equity affiliate business |
|
Noncontrolling interest |
1,290 (30% * 4,300) |
NCI in business B – this is equity value * the % owned by NCI – or total equity less group owned |
|
Total enterprise value |
9,002.5 (5,612.5 + 2,100 + 1,290) |
Sum of the above and also sum of TEV for controlled businesses plus % of equity affiliate owned |
|
Equity affiliates (EA) |
652.5 (45% * 1,450) |
Equity affiliate in business C – this is equity value * the % owned by group |
|
Enterprise value |
8,350 (9,002.5 – 652.5) |
Total enterprise value less the equity affiliates |
In summary
Sum-of-the-parts analysis estimates the TEV of the parent by adding up the individually estimated TEVs of the companies involved. If a company is controlled by the parent then its TEV is already part of the parent’s TEV. If a company is not controlled by the parent, then only the relevant equity investment is part of the parent’s total equity and hence its TEV.
Please do not hesitate to contact us, if you are having trouble viewing or accessing this article.
Copyright© 2016 AMT Training
More articles from our Knowledgebank

Quickly approximate a Bloomberg historical beta calculation using Microsoft Excel

